Chart Marks #
Six constructor options draw facts the chart data already carries but the wheel
never showed. All six default to False, so nothing new arrives on an upgrade,
and each is silent where it has no referent — a chart with no station, a
tropical zodiac, a house system that was honoured. Turning one on therefore
cannot produce an empty claim: a chart that shows nothing is telling you there
was nothing to show.
| Option | Where it draws |
|---|---|
show_motion_state |
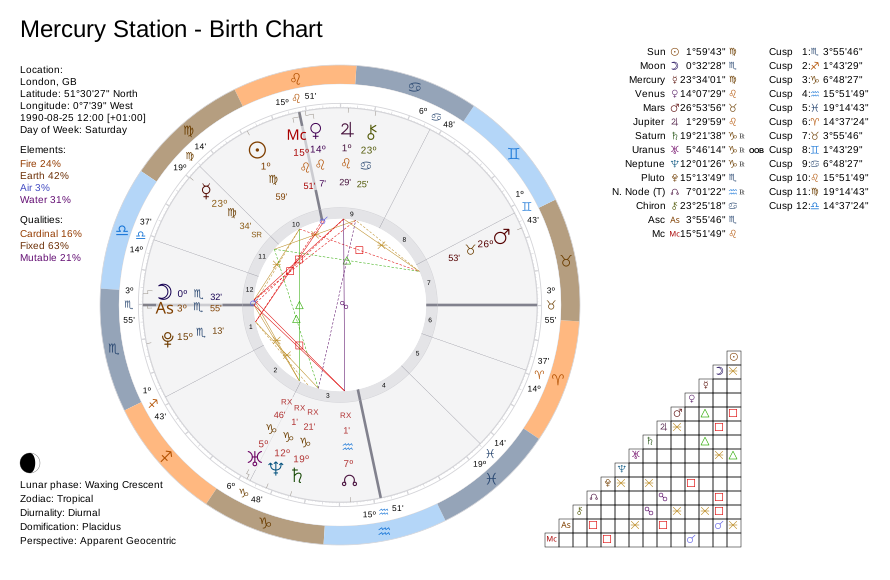
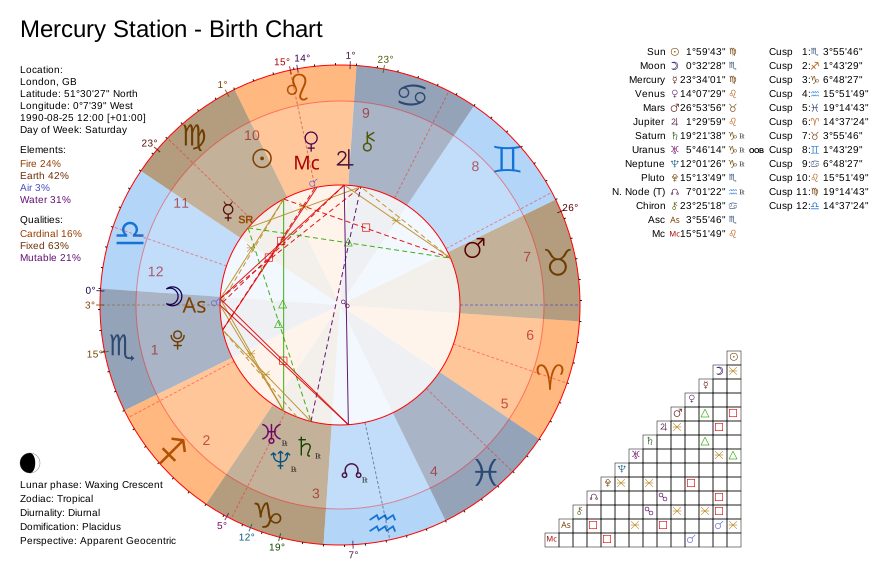
On the wheel: SR at a retrograde station, SD at a direct one, in the row that already holds RX. The modern style also recolours the planet’s cluster. |
show_out_of_bounds |
In the point tables, as an OOB badge past the retrograde glyph; in the Gauquelin grid, off the declination column. |
show_aspect_movement |
On the aspect lines: a separating aspect is dashed, an applying one stays solid. |
show_relationship_score |
In the info panel: Relationship Score: 16 (Very Important). Needs a score on the chart data. |
show_ayanamsa_value |
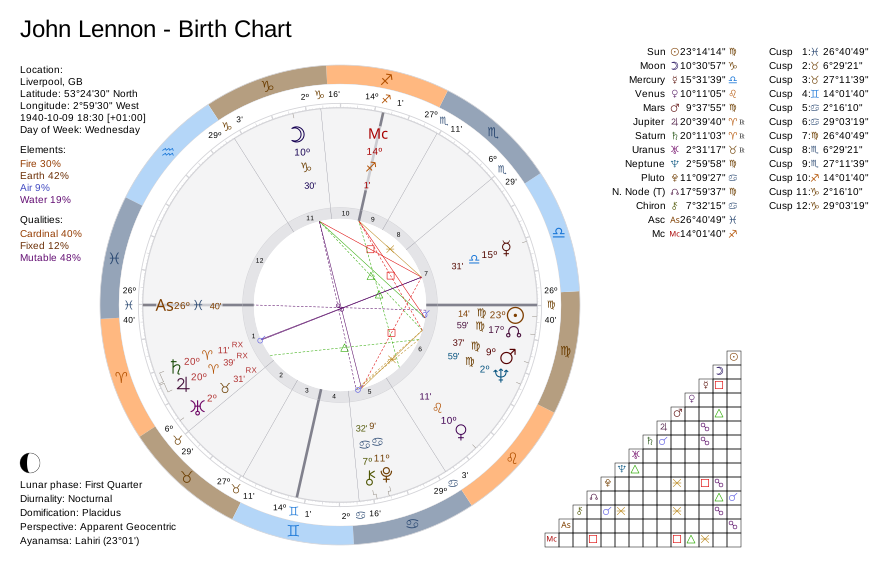
On a sidereal chart’s zodiac line, after the mode name: Ayanamsa: Lahiri (23°43'). |
show_polar_fallback_note |
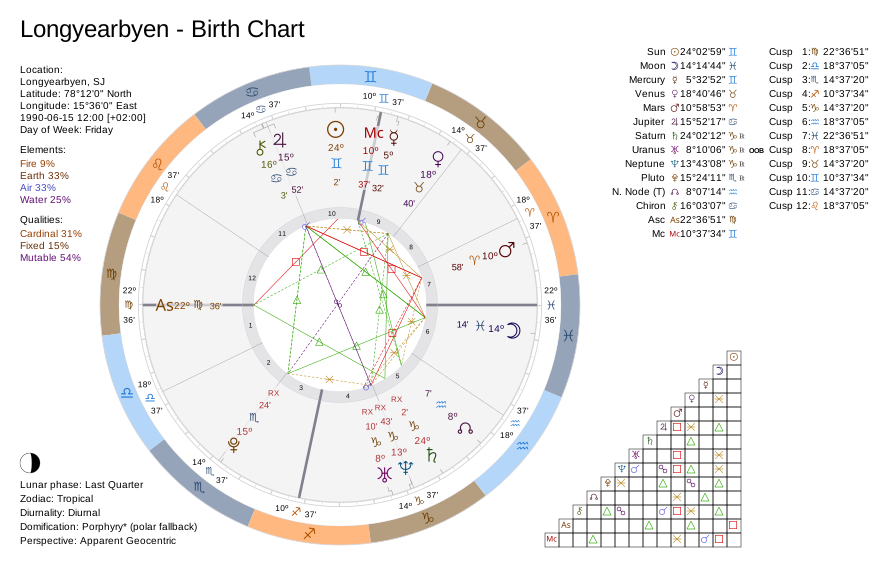
On the domification line, as Porphyry* (polar fallback), when the requested system was substituted. |
Full reference: Optional Marks.
Turning them all on #
Switching on every mark is safe, and is how one flag set serves very different charts without any of them claiming something it does not have.
from pathlib import Path

from kerykeion import AstrologicalSubjectFactory, ChartDataFactory, ChartDrawer

MARKS_ALL_ON = {
    "show_motion_state": True,
    "show_out_of_bounds": True,
    "show_aspect_movement": True,
    "show_relationship_score": True,
    "show_ayanamsa_value": True,
    "show_polar_fallback_note": True,
}

output_dir = Path("charts_output")
output_dir.mkdir(exist_ok=True)
Stations, out-of-bounds, and aspect movement #
25 August 1990 carries three referents at once: Mercury crawls at 0.012°/day — a stationary retrograde — and Uranus sits past the Sun’s maximum declination.
subject = AstrologicalSubjectFactory.from_birth_data(
    "Mercury Station", 1990, 8, 25, 12, 0,
    city="London", nation="GB",
    lng=-0.1276, lat=51.5074, tz_str="Europe/London",
    online=False,
)

chart_data = ChartDataFactory.create_natal_chart_data(subject)

print(subject.mercury.motion_state)      # stationary_retrograde
print(subject.uranus.is_out_of_bounds)   # True

ChartDrawer(chart_data, **MARKS_ALL_ON).save_svg(
    output_path=output_dir,
    filename="marks-wheel",
)
Output:
stationary_retrograde
True
The same chart in the classic style, which writes the station letters at the
foot of the glyph where its ℞ sits:
The ayanamsa value #
show_ayanamsa_value appends the offset to the zodiac line, and only a sidereal
chart has one to append.
sidereal = AstrologicalSubjectFactory.from_birth_data(
    "John Lennon", 1940, 10, 9, 18, 30,
    city="Liverpool", nation="GB",
    lng=-2.9916, lat=53.4084, tz_str="Europe/London",
    zodiac_type="Sidereal", sidereal_mode="LAHIRI",
    online=False,
)

ChartDrawer(
    ChartDataFactory.create_natal_chart_data(sidereal), **MARKS_ALL_ON
).save_svg(output_path=output_dir, filename="marks-sidereal")
The polar fallback note #
Placidus is undefined inside the polar circle, so the cusps came from another
system, and show_polar_fallback_note is what makes the info panel admit it.
polar = AstrologicalSubjectFactory.from_birth_data(
    "Longyearbyen", 1990, 6, 15, 12, 0,
    city="Longyearbyen", nation="SJ",
    lng=15.6, lat=78.2, tz_str="Arctic/Longyearbyen",
    houses_system_identifier="P",
    online=False,
)

print(polar.effective_houses_system_identifier)  # "O" — Porphyry stood in

ChartDrawer(
    ChartDataFactory.create_natal_chart_data(polar), **MARKS_ALL_ON
).save_svg(output_path=output_dir, filename="marks-polar")
Output:
O
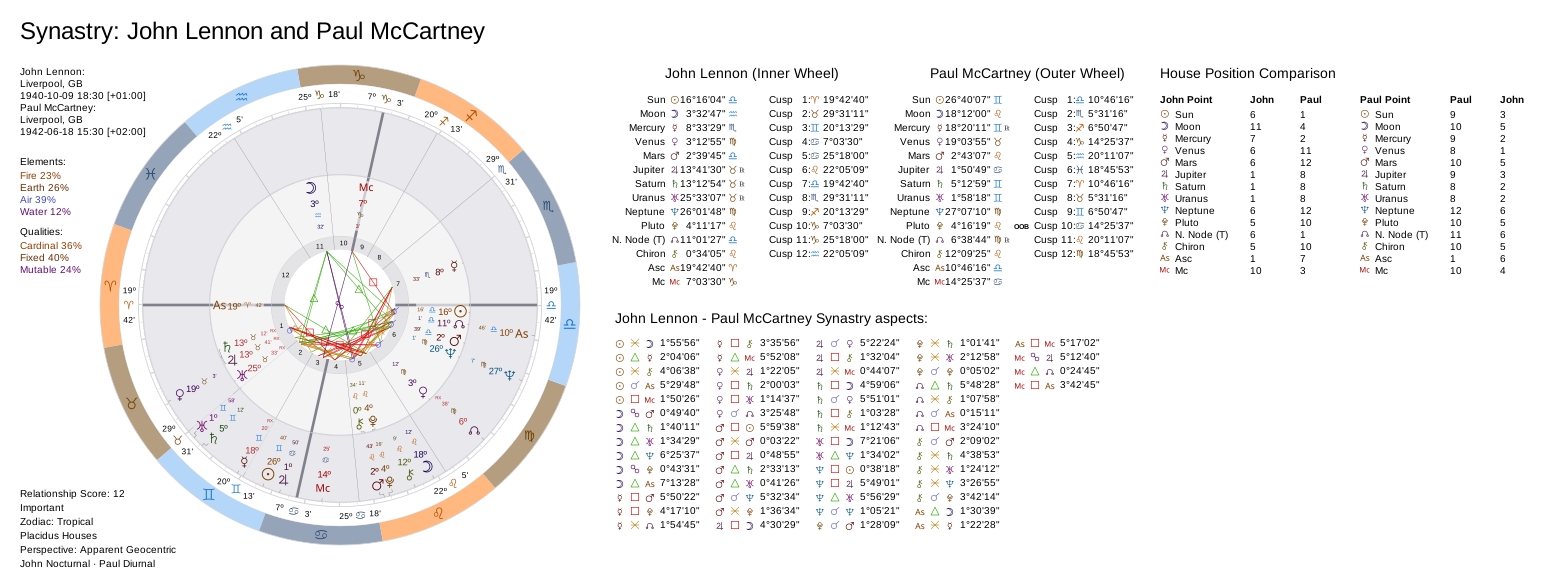
The relationship score #
create_synastry_chart_data computes a score unless
include_relationship_score=False, and show_relationship_score prints it.
john = AstrologicalSubjectFactory.from_birth_data(
    "John Lennon", 1940, 10, 9, 18, 30,
    city="Liverpool", nation="GB",
    lng=-2.9916, lat=53.4084, tz_str="Europe/London",
    online=False,
)
paul = AstrologicalSubjectFactory.from_birth_data(
    "Paul McCartney", 1942, 6, 18, 15, 30,
    city="Liverpool", nation="GB",
    lng=-2.9916, lat=53.4084, tz_str="Europe/London",
    online=False,
)

ChartDrawer(
    ChartDataFactory.create_synastry_chart_data(john, paul), **MARKS_ALL_ON
).save_svg(output_path=output_dir, filename="marks-synastry")
The state is in the SVG either way #
The marks decide what a reader sees drawn, not what the markup carries. Every
ChartPoint group already holds kr:motionstate, kr:speed, kr:declination,
kr:oob and kr:retrograde whether or not the corresponding option is on — so
a consumer parsing the SVG never needs them switched on. See
Point State.