Transit Chart #
The Transit Chart functionality allows you to analyze the transits of celestial bodies relative to a natal chart. This can provide insights into current influences and future trends.
Creating a Transit Chart #
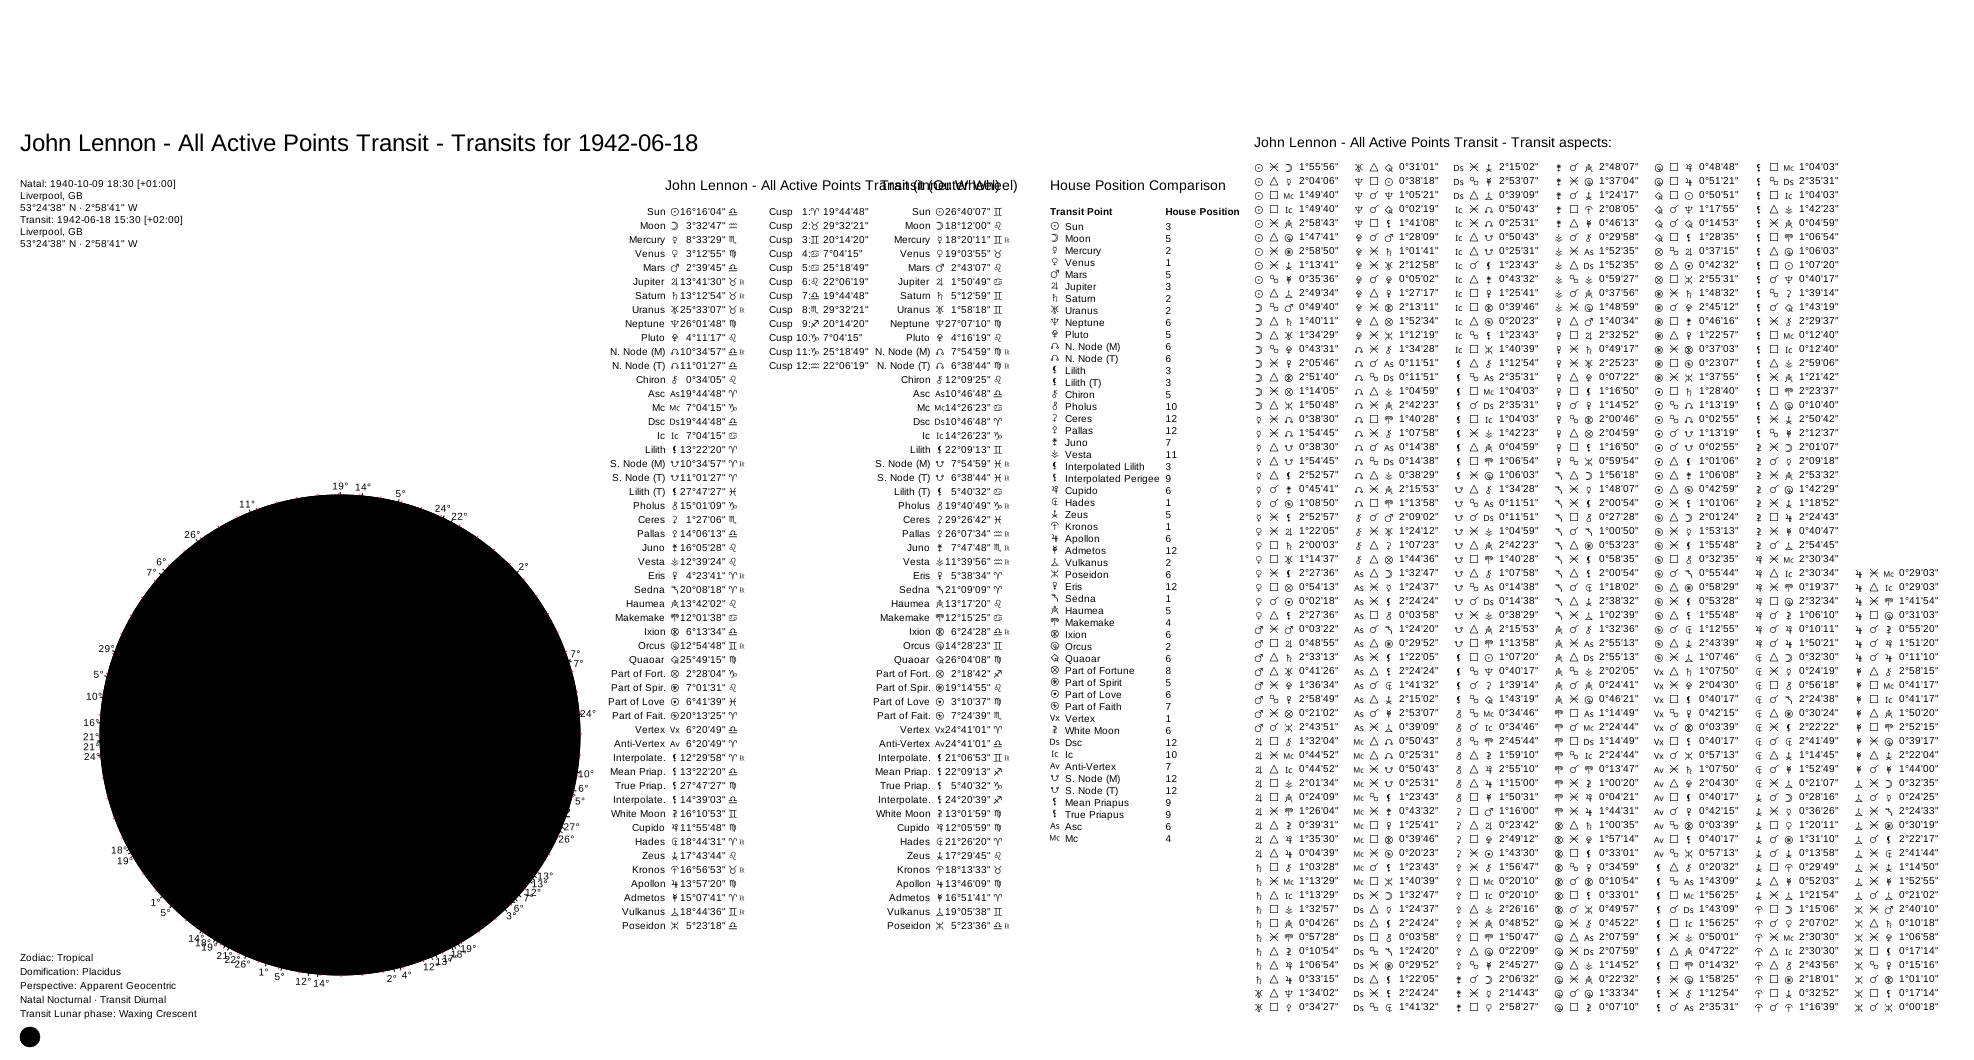
To create a Transit Chart, create two subjects (one for the natal chart, one for the transit snapshot), build the chart data via ChartDataFactory, then render with ChartDrawer.
from pathlib import Path
from kerykeion import AstrologicalSubjectFactory
from kerykeion.chart_data.factory import ChartDataFactory
from kerykeion.charts.drawer import ChartDrawer

# Create astrological subjects (offline example)
natal_subject = AstrologicalSubjectFactory.from_birth_data(
    "John Lennon", 1940, 10, 9, 18, 30,
    lng=-2.9833, lat=53.4, tz_str="Europe/London", online=False,
)
transit_subject = AstrologicalSubjectFactory.from_birth_data(
    "Current Transits", 2025, 1, 1, 0, 0,
    lng=-2.9833, lat=53.4, tz_str="Europe/London", online=False,
)

# Transit chart data and rendering
chart_data = ChartDataFactory.create_transit_chart_data(natal_subject, transit_subject)
drawer = ChartDrawer(chart_data=chart_data)

out_dir = Path("charts_output")
out_dir.mkdir(exist_ok=True)
drawer.save_svg(output_path=out_dir, filename="lennon-transit", style="classic")
The output will be:
Aspect Table Grid View #
double_chart_aspect_grid_type="table" renders the dual-chart aspects as a grid
instead of the default "list", which is easier to scan when a transit chart
carries many contacts.
from kerykeion import AstrologicalSubjectFactory
from kerykeion.chart_data.factory import ChartDataFactory
from kerykeion.charts.drawer import ChartDrawer

natal_subject = AstrologicalSubjectFactory.from_birth_data(
    "John Lennon", 1940, 10, 9, 18, 30,
    lng=-2.9833, lat=53.4, tz_str="Europe/London", online=False,
)
transit_subject = AstrologicalSubjectFactory.from_birth_data(
    "Current Transits", 2025, 1, 1, 0, 0,
    lng=-2.9833, lat=53.4, tz_str="Europe/London", online=False,
)

data = ChartDataFactory.create_transit_chart_data(natal_subject, transit_subject)
drawer = ChartDrawer(data, double_chart_aspect_grid_type="table")
drawer.save_svg(output_path="./charts_output", filename="lennon-transit-grid")
Customizing the Output Directory #
If you want to save the output in a different directory, pass the output_path parameter to save_svg(). If the path does not exist, create it beforehand.
Here is an example:
from pathlib import Path
from kerykeion import AstrologicalSubjectFactory
from kerykeion.chart_data.factory import ChartDataFactory
from kerykeion.charts.drawer import ChartDrawer

natal_subject = AstrologicalSubjectFactory.from_birth_data(
    "John Lennon", 1940, 10, 9, 18, 30,
    lng=-2.9833, lat=53.4, tz_str="Europe/London", online=False,
)
transit_subject = AstrologicalSubjectFactory.from_birth_data(
    "Current Transits", 2025, 1, 1, 0, 0,
    lng=-2.9833, lat=53.4, tz_str="Europe/London", online=False,
)

data = ChartDataFactory.create_transit_chart_data(natal_subject, transit_subject)
drawer = ChartDrawer(data)

out_dir = Path("charts_output")
out_dir.mkdir(exist_ok=True)
drawer.save_svg(output_path=out_dir, filename="transit-example")
The output will be saved in the specified directory.