Charts Visualization #
The ChartDrawer class is the generic visualization engine. It renders professional SVG charts from pre-calculated data.
Design Philosophy #
Kerykeion follows a separation of concerns principle:
ChartDataFactoryhandles all astronomical calculations (planetary positions, aspects, elements, etc.)ChartDrawerfocuses purely on visualization (drawing wheels, aspect grids, labels)
This decoupling means you can:
- Generate chart data once and render it in multiple formats/themes
- Perform calculations without needing visual output
- Swap visualization engines without touching calculation logic
Standard Workflow #
Creating any chart follows the same 3-step process:
- Create Subject(s): Use
AstrologicalSubjectFactory. - Generate Data: Use
ChartDataFactoryto calculate positions and aspects. - Draw: Use
ChartDrawerto render the SVG.
from kerykeion import AstrologicalSubjectFactory, ChartDataFactory, ChartDrawer

# 1. Subject (offline: explicit coordinates, no GeoNames lookup)
subject = AstrologicalSubjectFactory.from_birth_data(
    "Alice", 1990, 6, 15, 12, 0,
    lng=-0.1276, lat=51.5074, tz_str="Europe/London",
    online=False,
)

# 2. Data
chart_data = ChartDataFactory.create_natal_chart_data(subject)

# 3. Draw
drawer = ChartDrawer(chart_data)
svg_content = drawer.generate_svg_string()
Chart Types #
The drawing process is identical for all types; only the Data Generation step changes.
Natal #
The basic birth chart. Shows planetary positions and house cusps for a single subject at the time of birth.
chart_data = ChartDataFactory.create_natal_chart_data(subject)
drawer = ChartDrawer(chart_data)
To place planets on the outer ring instead of the inner ring, use external_view=True:
drawer = ChartDrawer(chart_data, external_view=True)
Synastry (Comparison) #
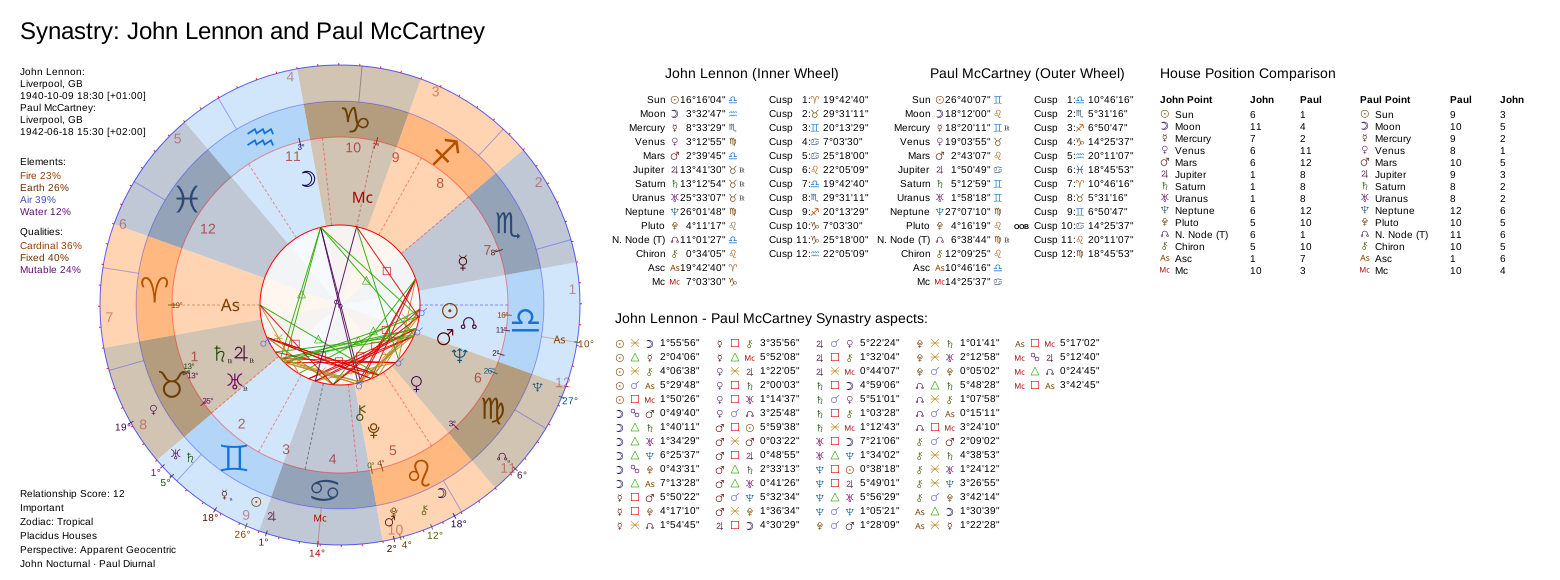
Synastry charts overlay two users’ planetary positions to visualize their relationship. The outer wheel shows the second subject’s planets.
# Create the two subjects to compare
subject_a = AstrologicalSubjectFactory.from_birth_data(
    "Alice", 1990, 6, 15, 12, 0,
    lng=-0.1276, lat=51.5074, tz_str="Europe/London", online=False
)
subject_b = AstrologicalSubjectFactory.from_birth_data(
    "Bob", 1992, 8, 20, 14, 30,
    lng=-74.0060, lat=40.7128, tz_str="America/New_York", online=False
)

# Create chart data for the two subjects
synastry_data = ChartDataFactory.create_synastry_chart_data(subject_a, subject_b)
drawer = ChartDrawer(synastry_data)
Transits #
Transit charts compare a static natal chart (inner wheel) against the current moving sky (outer wheel) to analyze current astrological influences.
# Compare natal chart against current time
current_time_subject = AstrologicalSubjectFactory.from_current_time(
    lng=-0.1276, lat=51.5074, tz_str="Europe/London", online=False
)
transit_data = ChartDataFactory.create_transit_chart_data(subject, current_time_subject)
drawer = ChartDrawer(transit_data)
Composite (Midpoint) #
Composite charts display a single wheel calculated from the midpoints of two subjects, representing the relationship as a unified entity.
from kerykeion.composite_subject.factory import CompositeSubjectFactory

# Create composite subject first
composite_sub = CompositeSubjectFactory(subject_a, subject_b).get_midpoint_composite_subject_model()
composite_data = ChartDataFactory.create_composite_chart_data(composite_sub)
drawer = ChartDrawer(composite_data)
Solar / Lunar Return (Dual Wheel) #
Dual return charts show the natal chart (inner wheel) alongside the return moment (outer wheel). They include house comparison grids.
from kerykeion import PlanetaryReturnFactory

# Initialize the return factory with the return location
return_factory = PlanetaryReturnFactory(subject, city="London", nation="GB")

# Calculate solar return (search from Jan 1, 2025)
return_model = return_factory.next_return_from_date(2025, 1, 1, return_type="Solar")

# Dual wheel: natal vs return
return_data = ChartDataFactory.create_return_chart_data(subject, return_model)
drawer = ChartDrawer(return_data)
The same works for lunar returns:
return_factory = PlanetaryReturnFactory(subject, city="London", nation="GB")
return_model = return_factory.next_return_from_date(2025, 3, 1, return_type="Lunar")
return_data = ChartDataFactory.create_return_chart_data(subject, return_model)
drawer = ChartDrawer(return_data)
Solar / Lunar Return (Single Wheel) #
Single return charts show only the return moment as a standalone chart, without the natal comparison.
return_factory = PlanetaryReturnFactory(subject, city="London", nation="GB")
return_model = return_factory.next_return_from_date(2025, 1, 1, return_type="Solar")
return_data = ChartDataFactory.create_single_wheel_return_chart_data(return_model)
drawer = ChartDrawer(return_data)
Chart Styles #
Kerykeion supports two visual styles for chart rendering.
Modern (Default) #
A concentric-ring layout with graduated ruler scales, aspect lines with midpoint glyphs, and a cleaner visual hierarchy. Supports all chart types (single and dual wheel). Since v6 this is the default style — a render without a style argument produces the modern layout.
from pathlib import Path

output_path = Path("charts_output")
output_path.mkdir(exist_ok=True)

drawer.save_svg(output_path, filename="chart")  # modern by default
drawer.save_wheel_only_svg_file(output_path, filename="wheel")
Modern-only parameters (keyword arguments, ignored by the classic style):
| Parameter | Type | Default | Description |
|---|---|---|---|
show_zodiac_background_ring |
bool |
True |
Draw colored zodiac wedges behind the outer planet ring. |
glyph_size |
str |
"medium" |
Planet-cluster size: "small" (medium at 90%), "medium", or "large" (the planet glyph at the classic style’s own size, in the default configuration — zodiac background ring active, per-glyph optical map applied). |
Classic #
The traditional astrological wheel layout with concentric rings for signs, houses, and planets.
drawer.save_svg(output_path, filename="chart", style="classic")
drawer.save_wheel_only_svg_file(output_path, filename="wheel", style="classic")
The classic-only options external_view, show_degree_indicators and show_aspect_icons only take effect with style="classic"; the modern renderer ignores them and logs a warning.
style and show_zodiac_background_ring can also be set on the ChartDrawer constructor as per-instance defaults. Per-render overrides via the render methods still work.
Configuration & Customization #
The ChartDrawer accepts several parameters to customize the visual output.
drawer = ChartDrawer(
    chart_data=chart_data,
    theme="dark",
    chart_language="IT",
    show_aspect_icons=True
)
Themes #
"classic"(Default): White background, traditional look."dark": Modern dark mode."black-and-white": High contrast monochrome for print.None: No CSS theme is emitted at all. The drawing inherits its colours from the document that hosts it, which is what an embedded chart on a themed page wants. Any other value raisesKerykeionException.
Languages #
Supported: EN, IT, FR, ES, PT, CN, RU, TR, DE, HI.
Optional Marks #
Six constructor options draw facts the chart data already carries but the wheel
never showed. All six default to False, and passing every one of them its own
default reproduces the SVG the previous release produced, byte for byte: each
adds ink the reader did not ask for, so none of them arrives on an upgrade.
Every mark is silent where it has no referent — a chart with no station, data that never computed a score, a tropical zodiac, a house system that was honoured. Turning an option on therefore cannot produce an empty claim, and a chart that shows nothing is telling you there was nothing to show.
| Parameter | Where it draws |
|---|---|
show_motion_state |
On the wheel. The modern style recolours the planet’s cluster and writes SR/SD in the row that already holds RX; the classic style writes the same two letters at the foot of the glyph, where its ℞ sits. |
show_out_of_bounds |
In the point tables, as an OOB badge past the retrograde glyph. In the Gauquelin grid it hangs off the declination column, which is what it is a claim about. |
show_aspect_movement |
On the aspect lines: a separating aspect is dashed, an applying one stays solid. |
show_relationship_score |
In the info panel, as Relationship Score: 16 (Very Important). Needs a score on the chart data — create_synastry_chart_data computes one unless include_relationship_score=False. |
show_ayanamsa_value |
On the zodiac line of a sidereal chart, after the mode name: Ayanamsa: Lahiri (23°43'). Degrees and minutes only. |
show_polar_fallback_note |
On the domification line, as Porphyry* (polar fallback), when the requested system was undefined at that latitude and another stood in for it. |
A station is reported as SR where the retrograde phase opens and SD where it
closes — the same two labels RetrogradeStationFactory
uses for the events themselves. The sign of the speed cannot tell the two apart:
both stations are approached from one side of zero and left on the other, so the
distinction comes from the motion state on the point, not from the number.
A station and a plain retrograde are mutually exclusive, so the station label
takes the marker row rather than adding one.
from kerykeion import AstrologicalSubjectFactory, ChartDataFactory, ChartDrawer

# 25 August 1990: Mercury crawls at 0.012°/day — a stationary retrograde — and
# Uranus sits past the Sun's maximum declination, so it is out of bounds.
subject = AstrologicalSubjectFactory.from_birth_data(
    "Mercury Station", 1990, 8, 25, 12, 0,
    lng=-0.1276, lat=51.5074, tz_str="Europe/London",
    online=False, suppress_geonames_warning=True,
)
chart_data = ChartDataFactory.create_natal_chart_data(subject)

drawer = ChartDrawer(
    chart_data,
    show_motion_state=True,
    show_out_of_bounds=True,
    show_aspect_movement=True,
)
svg = drawer.generate_svg_string()

print(subject.mercury.motion_state)     # stationary_retrograde
print(subject.uranus.is_out_of_bounds)  # True
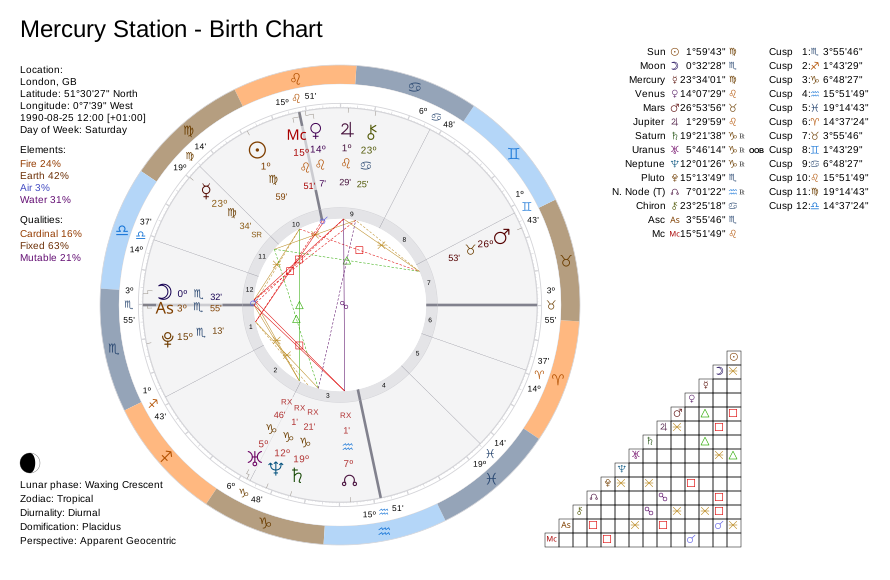
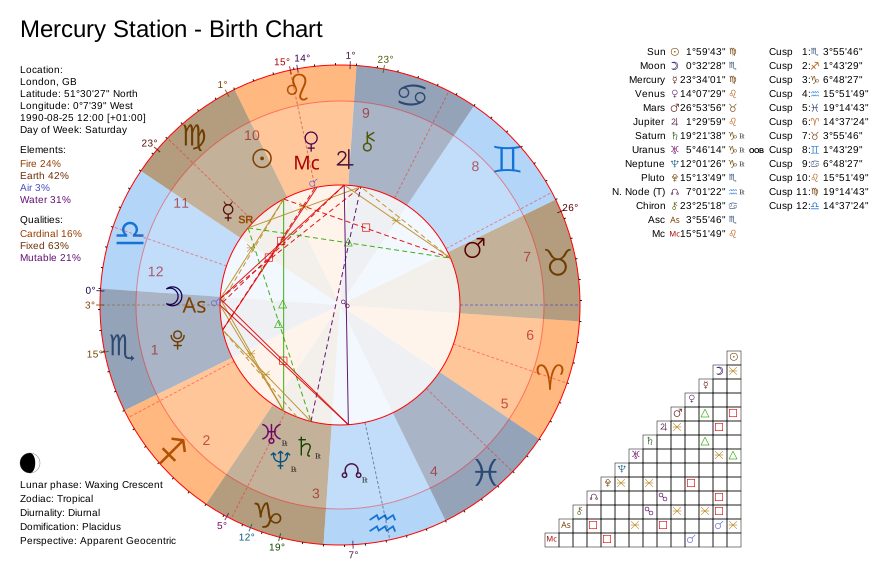
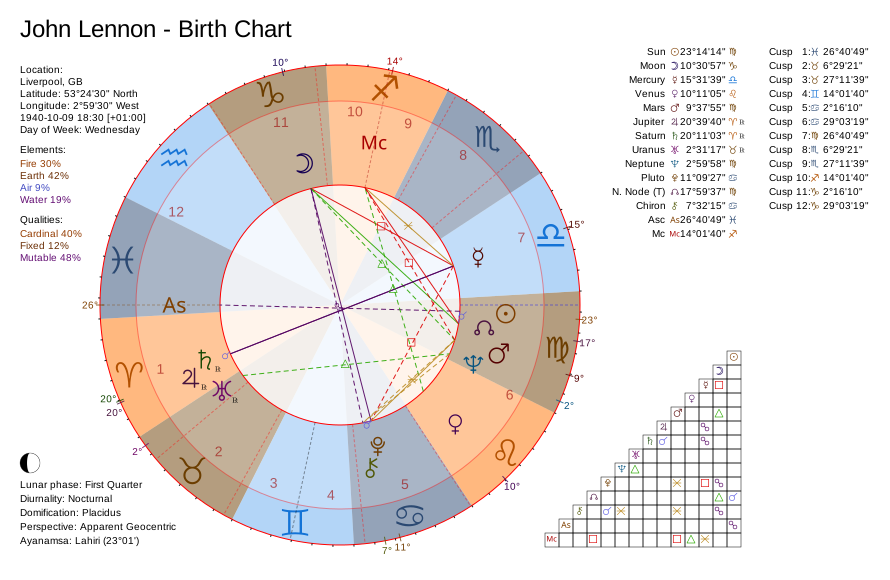
The three remaining options need charts that have their referent — a synastry, a
sidereal chart and a subject inside the polar circle. examples/svg_extended_example.py
renders all four cases, and the four below are those cases rendered, with every
option switched on:
 |
 |
Modern — the station recolours Mercury’s cluster and writes SR in the row that holds RX |
Classic — the same two letters at the foot of the glyph, where ℞ sits |
 |
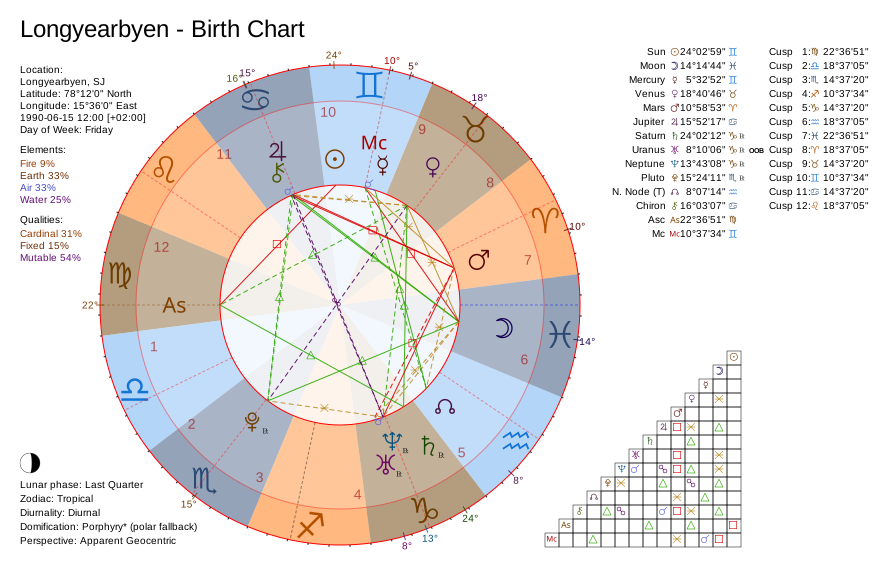 |
| Ayanamsa offset — the degrees next to the mode name | Polar fallback — Placidus was undefined at 78°N, so the line names what drew the cusps |
Relationship score — the value and its band, in one of the two panel rows a synastry leaves empty.
from kerykeion import AstrologicalSubjectFactory, ChartDataFactory, ChartDrawer

polar = AstrologicalSubjectFactory.from_birth_data(
    "Polar Fallback", 1990, 6, 15, 12, 0,
    lng=15.6, lat=78.2, tz_str="Arctic/Longyearbyen",
    houses_system_identifier="P",  # undefined this far north
    online=False, suppress_geonames_warning=True,
)
polar_svg = ChartDrawer(
    ChartDataFactory.create_natal_chart_data(polar),
    show_polar_fallback_note=True,
).generate_svg_string()

print(polar.effective_houses_system_name)  # Porphyry — Placidus could not be used
print("polar fallback" in polar_svg)       # True
Output Methods & API Reference #
1. Generating Strings (Web/API) #
Methods to get the raw SVG code as a string.
# Full Chart
svg = drawer.generate_svg_string()

# Components
wheel_only = drawer.generate_wheel_only_svg_string()
grid_only = drawer.generate_aspect_grid_only_svg_string()
2. Saving to File (CLI/Scripts) #
Methods to write the SVG directly to disk.
from pathlib import Path

output_dir = Path("charts_output")
output_dir.mkdir(exist_ok=True)

# Full Chart
drawer.save_svg(output_dir, filename="natal_chart")

# Components
drawer.save_wheel_only_svg_file(output_dir, filename="wheel_only")
drawer.save_aspect_grid_only_svg_file(output_dir, filename="grid_only")
Class ChartDrawer #
Constructor Parameters:
Everything after chart_data is keyword-only.
| Parameter | Type | Default | Description |
|---|---|---|---|
chart_data |
ChartDataModel |
Required | Pre-computed data from a Factory. |
theme |
KerykeionChartTheme | None |
"classic" |
Visual theme ("classic", "dark", "black-and-white"); None emits no CSS. |
chart_language |
KerykeionChartLanguage |
"EN" |
Label language ("IT", "ES", etc). |
transparent_background |
bool |
False |
Remove background color. |
external_view |
bool |
False |
Place planets on outer ring (Single chart). |
show_aspect_icons |
bool |
True |
Show symbol icons in aspect grid. |
show_degree_indicators |
bool |
True |
Show degree ticks on the wheel. |
custom_title |
str |
None |
Override the default chart title. |
double_chart_aspect_grid_type |
"list", "table" |
"list" |
Grid style for Synastry/Transit. |
auto_size |
bool |
True |
Automatically adjust chart dimensions. |
padding |
int |
20 |
Padding around the SVG content. |
style |
KerykeionChartStyle |
"modern" |
Chart wheel layout (“modern” or “classic”). Per-instance default for all render calls. |
show_zodiac_background_ring |
bool |
True |
Show colored zodiac wedges (modern style only). Per-instance default for all render calls. |
glyph_size |
KerykeionGlyphSize |
"medium" |
Planet-cluster size on the modern wheel ("small", "medium", "large"). Per-instance default for all render calls. |
show_diurnality |
bool |
True |
Print the chart’s diurnality (Sun above or below the horizon) in the info panel. |
show_motion_state |
bool |
False |
Mark planets at a station, “SR” or “SD” (see Optional Marks). |
show_out_of_bounds |
bool |
False |
Badge out-of-bounds planets in the point tables. |
show_aspect_movement |
bool |
False |
Dash the aspect lines that are separating. |
show_relationship_score |
bool |
False |
Print the synastry relationship score in the info panel. |
show_ayanamsa_value |
bool |
False |
Append the ayanamsa offset to the zodiac line of a sidereal chart. |
show_polar_fallback_note |
bool |
False |
Mark the domification line when the requested house system was substituted. |
show_house_position_comparison |
bool |
True |
Render the house position comparison grid (dual charts). |
show_cusp_position_comparison |
bool |
False |
Render the cusp position comparison grid alongside house comparison. |
colors_settings |
dict |
DEFAULT_CHART_COLORS |
Custom color settings for chart elements. |
celestial_points_settings |
Sequence |
DEFAULT_CELESTIAL_POINTS_SETTINGS |
Custom celestial point display settings. |
aspects_settings |
Sequence |
DEFAULT_CHART_ASPECTS_SETTINGS |
Custom aspect display settings. |
language_pack |
Mapping | None |
None |
Additional translations merged over bundled defaults. |
Public Methods:
All render/save methods accept minify and remove_css_variables. The full-chart methods (save_svg, generate_svg_string) additionally accept custom_title, style, show_zodiac_background_ring, and glyph_size; the wheel-only methods accept style, show_zodiac_background_ring, and glyph_size (see the method list below):
| Parameter | Type | Default | Description |
|---|---|---|---|
minify |
bool |
False |
Minify the SVG output (remove whitespace/comments). |
remove_css_variables |
bool |
False |
Inline all CSS variables for broader SVG viewer compatibility. |
custom_title |
Optional[str] |
None |
Override the chart title (full chart methods only). |
style |
KerykeionChartStyle |
chart default | Per-call style override (e.g. "classic"). |
show_zodiac_background_ring |
bool |
chart default | Per-call toggle for the zodiac background ring. |
glyph_size |
KerykeionGlyphSize |
chart default | Per-call planet-cluster size override (modern only). |
save_svg(output_path, filename, minify, remove_css_variables, *, custom_title, style, show_zodiac_background_ring, glyph_size) -> Nonegenerate_svg_string(minify, remove_css_variables, *, custom_title, style, show_zodiac_background_ring, glyph_size) -> strgenerate_wheel_only_svg_string(minify, remove_css_variables, *, style, show_zodiac_background_ring, glyph_size) -> strgenerate_aspect_grid_only_svg_string(minify, remove_css_variables) -> strsave_wheel_only_svg_file(output_path, filename, minify, remove_css_variables, *, style, show_zodiac_background_ring, glyph_size)save_aspect_grid_only_svg_file(output_path, filename, minify, remove_css_variables)
Where the files land. On every save_* method output_path and filename
both default to None. A None output_path writes to the user’s home
directory, and a None filename builds one from the subject and the chart
type:
| Method | Default filename |
|---|---|
save_svg |
{name} - {chart_type} Chart - Modern.svg, or ... - Classic.svg when the effective style is "classic" |
save_wheel_only_svg_file |
{name} - {chart_type} Chart - Modern Wheel Only.svg, or ... - Classic Wheel Only.svg |
save_aspect_grid_only_svg_file |
{name} - {chart_type} Chart - Aspect Grid Only.svg |
Pass an explicit output_path in any script that should not scatter charts
across the home directory. The basename is sanitised (path separators, .. and
leading dots become underscores) and a target resolving outside output_path
raises KerykeionException.
Machine-Readable SVG Point Metadata #
Every rendered celestial point is a <g kr:node="ChartPoint"> with stable
kr: attributes such as kr:slug, kr:house, kr:sign,
kr:absoluteposition, kr:signposition, kr:horoscope, and its root-space
glyph center (kr:cx, kr:cy).
In dual wheels—Transit, Synastry, DualReturnChart, and Progression—house meaning is explicit on both rings:
| Attribute | Meaning |
|---|---|
kr:house |
The point’s house in its owner’s horoscope. |
kr:horoscope |
Owner ring: 0 for the first subject, 1 for the second. |
kr:projectedhouse |
The same longitude’s house in the other subject’s cusp system. |
kr:projectedhoroscope |
Target ring used for kr:projectedhouse. |
The reciprocal attributes are present in classic and modern styles, full and
wheel-only output, and do not require the optional house_comparison payload
or visible comparison tables. They are additive metadata; existing geometry
and the owner semantics of kr:house are unchanged.
Point State #
Each ChartPoint also carries the physical state the model computed for it. These attributes are not gated by a rendering option: they are data, not decoration, and the Optional Marks above decide only whether a reader sees them drawn. They are identical in classic and modern styles and in full and wheel-only output — a consumer must be able to tell a body that has no such state from a chart style that forgot to say so.
| Attribute | Emitted when | Value |
|---|---|---|
kr:motionstate |
the point has a motion_state |
A MotionState literal. |
kr:speed |
the point has a speed | Degrees/day, rounded to 6 decimals. |
kr:declination |
the point has a declination | Degrees, rounded to 4 decimals. |
kr:oob |
the point is out of bounds | "true". |
kr:magnitude |
fixed stars | Apparent visual magnitude, 2 decimals. |
kr:nearpoint |
a fixed star surfaced by discovery | The point that brought the star in. |
kr:orb |
a fixed star surfaced by discovery | Arc to that point in degrees, 4 decimals. |
kr:retrograde |
the point is retrograde | "true". |
Chart-level analyses are annotated onto the finished markup rather than emitted by the point serializers, and in a dual wheel each ring is annotated from its own subject’s analysis:
| Attribute | Emitted when | Value |
|---|---|---|
kr:angularity |
the point stands on one or more angles | Angle:distance pairs separated by a space, closest first: Ascendant:0.8991 Medium_Coeli:4.3156. |
kr:stellium |
the point belongs to a stellium | The house of the crowd, e.g. Fifth_House. |
kr:angularity is one attribute holding a list rather than a pair of scalar
attributes, because the analysis is genuinely one-to-many: near the poles the
Ascendant and the Midheaven close on each other and a planet can sit within orb
of both. Repeating a pair of attributes per angle would repeat the attribute
names, which is not valid XML, and keeping only the closest angle would drop
what the chart data deliberately reports. parse_chart_points returns the
pairs already split, as ChartPointTag.angularities.
An attribute is absent when the model does not carry the value. Silence is
not a default: it means the chart does not compute that quantity, which is a
different claim from a value of zero or false. Motion state and out-of-bounds
are geocentric-only, so a heliocentric chart states neither; a midpoint
composite is a construction rather than a sky, so its points have no speed to
classify and no motion state at all. kr:oob goes one step further and follows
kr:retrograde in marking only the exception — the rule is not worth an
attribute.
Attribute names are lowercase letters only, with no separators. Consumers
rewrite the namespace with a general pattern rather than an allow-list (a
browser client maps kr:name to data-kr-name through /\bkr:([a-zA-Z]+)=/
before sanitizing), so a name carrying an underscore or a digit would be dropped
in silence instead of rejected loudly. That is why the attributes read
motionstate and nearpoint rather than motion_state and near_point.
Chart-Level Nodes #
Every group the renderer emits carries a kr:node tag naming what it is —
ChartPoint, Glyph, Cusp, CuspRing, HouseSector, HouseNumber,
HouseRing, PlanetRing, RulerRing, Aspect, AspectCore,
AspectsGridRect, ZodiacSign, ZodiacBackgrounds, GauquelinSector,
Indicator, ConnectingLine, and the wheel roots themselves. Selecting on
kr:node is how a consumer finds a layer without depending on element order.
The modern wheel root is <g kr:node="ModernHoroscope"> (single charts) or
<g kr:node="ModernDualHoroscope"> (Transit, Synastry, DualReturnChart,
Progression, which also carry kr:charttype). Both roots are stamped with the
planet-cluster size:
| Attribute | Emitted when | Value |
|---|---|---|
kr:glyphsize |
glyph_size is "small" or "large" |
"small" or "large". |
The default "medium" is written as absence, the same way kr:oob and
kr:retrograde mark only the exception. The classic style has no such root and
never stamps the attribute.
kerykeion.charts.svg_metadata holds both ends of this contract: the emitter
(point_state_attributes) and a parser that reads the markup back.
from kerykeion import AstrologicalSubjectFactory, ChartDataFactory, ChartDrawer
from kerykeion.charts.svg_metadata import parse_chart_points

subject = AstrologicalSubjectFactory.from_birth_data(
    "Mercury Station", 1990, 8, 25, 12, 0,
    lng=-0.1276, lat=51.5074, tz_str="Europe/London",
    online=False, suppress_geonames_warning=True,
)
svg = ChartDrawer(ChartDataFactory.create_natal_chart_data(subject)).generate_svg_string()

for point in parse_chart_points(svg):
    if point.motion_state == "stationary_retrograde" or point.out_of_bounds:
        print(point.slug, point.motion_state, point.speed, point.out_of_bounds)
Helper Functions (charts_utils) #
Import from: kerykeion.charts.utils
Utility functions used in SVG generation that can be helpful for custom rendering logic.
| Function | Description |
|---|---|
degree_difference(a, b) |
Smallest difference between two angles (0-180°). |
degree_sum(a, b) |
Sum of two angles normalized to 0-360°. |
normalize_degree(angle) |
Constrains any angle to 0-360° range. |
wheel_x(sign_index, radius, offset) |
Calculates X coordinate for a wheel sector (sign_index 0-11, 30° each). |
wheel_y(sign_index, radius, offset) |
Calculates Y coordinate for a wheel sector (sign_index 0-11, 30° each). |
from kerykeion.charts.utils import degree_difference

diff = degree_difference(350, 10) # Returns 20.0